Overview
The Market Evaluation page allows you to choose a specific market and product (code set) to analyze based on patient location. In short, you select the market and code set of interest, and the tables will display the related claim counts by payer types, by physicians, and by billing entities.
![]() All tables include claim counts for each listed entry for the most recent four quarters of data and for the most recent six quarters to provide a trended view.
All tables include claim counts for each listed entry for the most recent four quarters of data and for the most recent six quarters to provide a trended view.
| Click on the "Market Evaluation" button in the left navigation to open the Market Evaluation page. |  |
 In this article
This article shows you how to set up the page and the three tables listed.
-
Choosing Report Type, Market, and Code Set - Before you view the tables, you can choose what you will see in each table on the page.
- Choosing a Report Type
- State Report
- 3 Digit ZIP Code Report with map
- Table - National Claim Counts by Payer Type - Understand national trends for the selected code set broken out by payer type
- Table - Claim Counts by Payer Type - Claim volume for Medicare FFS, MA, Medicaid, Commercial and other plans
- Table - Physicians by Code Set by Patient Location - claim counts by physician for patients who reside in the selected location
- Table - Billing Entities by Code Set by Patient Location - claim counts by organizational billing entities for patients who reside in the selected location
- FAQs
Choosing Report Type, Market and Code Set
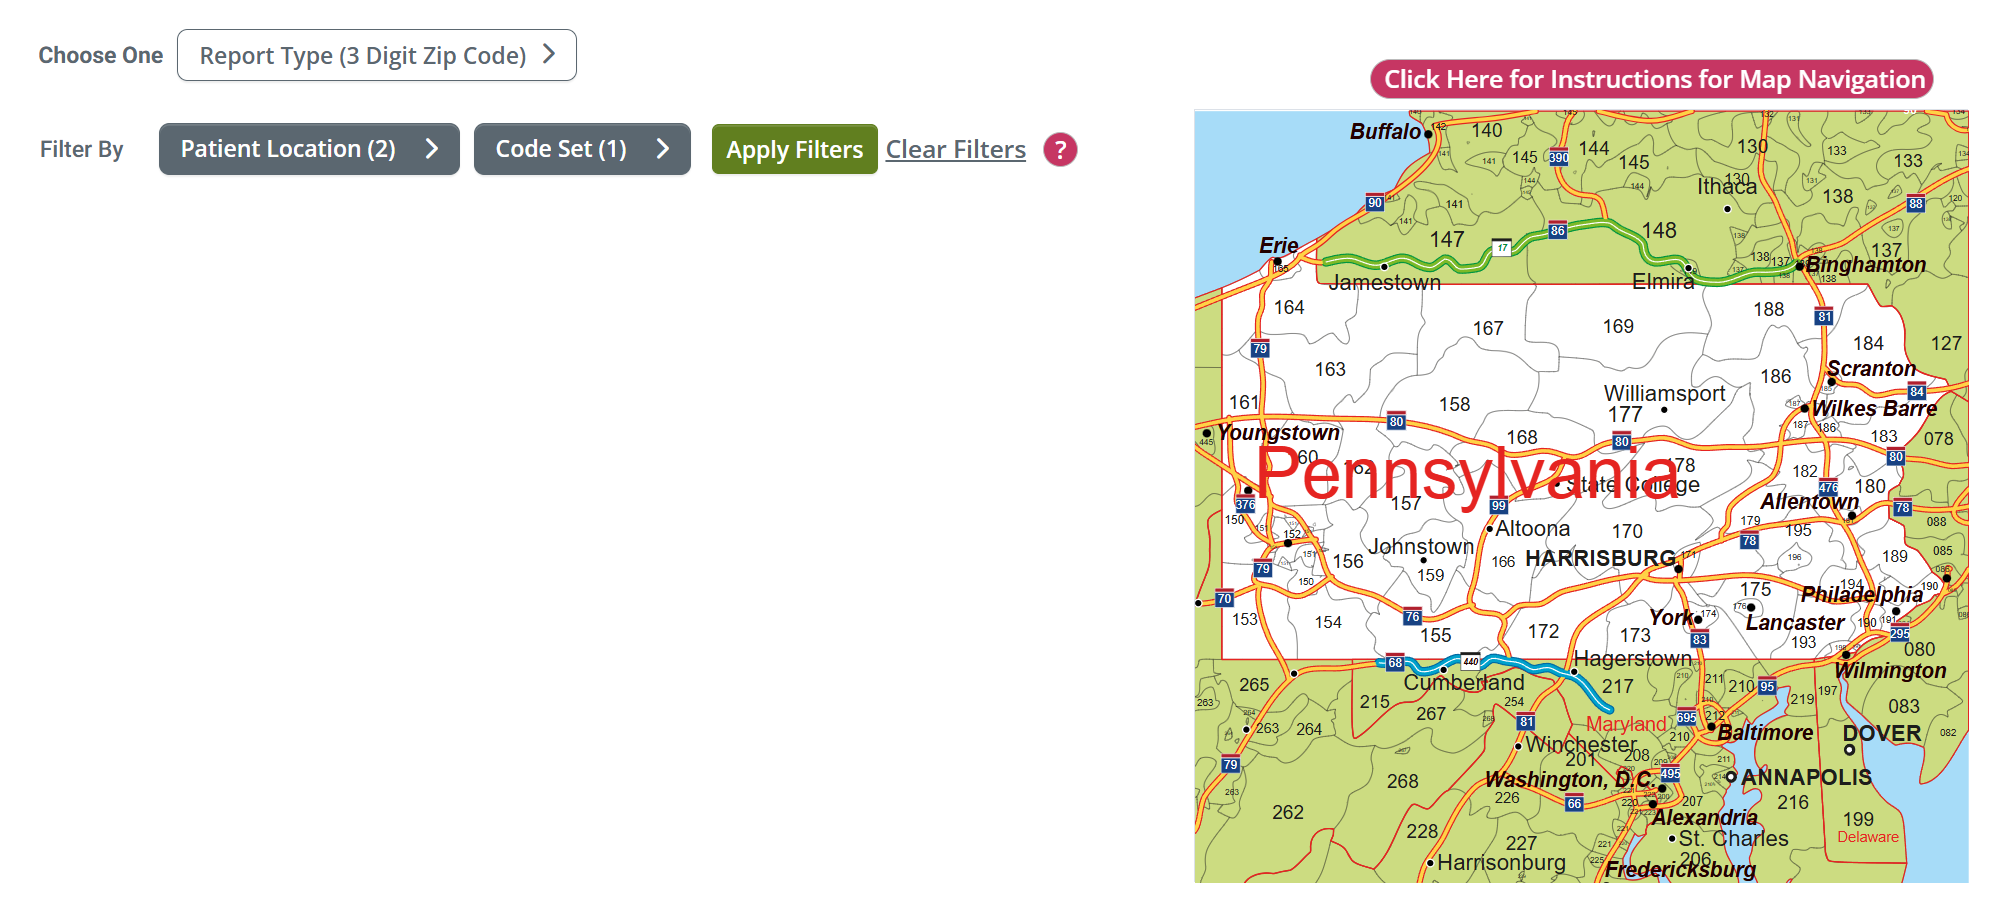
The content displayed in the tables on the Market Evaluation page will depend on the choices you make using the filters at the top of the page. Use the image as a reference for the details below.
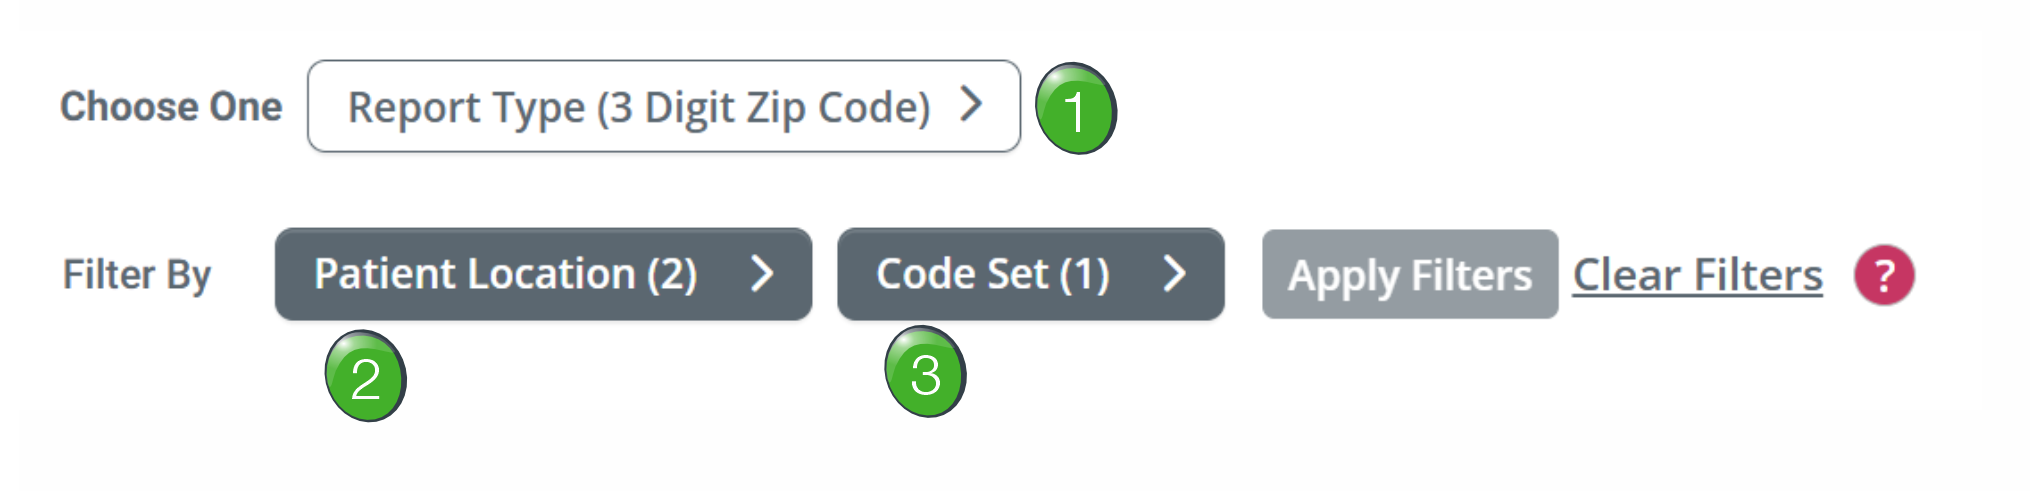
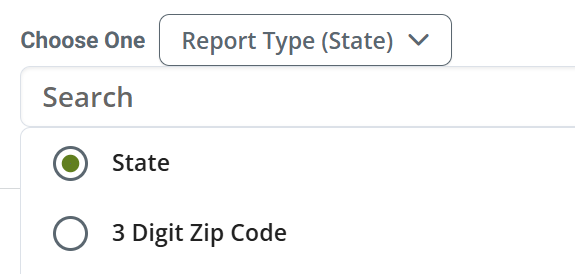
![]() Report Type - There are two types of reports: State or 3 Digit ZIP Code. Each of these report types are described in detail below. You can only choose one report type.
Report Type - There are two types of reports: State or 3 Digit ZIP Code. Each of these report types are described in detail below. You can only choose one report type.
- When you click on the "Choose One" button, you will be able to choose the report type you want to use. Click the report type you want, then click the "Choose One" button to close the dropdown options.
![]() Patient Location - This dropdown allows you to select the patient location of residence that will determine the market from which the metrics in the tables on the page will display. In either report type, you can select as many locations as your want.
Patient Location - This dropdown allows you to select the patient location of residence that will determine the market from which the metrics in the tables on the page will display. In either report type, you can select as many locations as your want.
- State - Choose one or more states. The tables on the page will show metrics that apply to patients in the chosen states.
![]() Obviously, using this report type will give you a broad market perspective. The States report will include Traditional Medicare metrics.
Obviously, using this report type will give you a broad market perspective. The States report will include Traditional Medicare metrics.
- ZIP Codes - Choose one or more states, but you can also choose specific ZIP codes for any states you select.
![]() Using the 3-digit report provides access to metrics for a more focused market. The 3-digit report will not display traditional Medicare metrics.
Using the 3-digit report provides access to metrics for a more focused market. The 3-digit report will not display traditional Medicare metrics.
![]() Detailed steps are shown below under State Report and 3-Digit ZIP Report.
Detailed steps are shown below under State Report and 3-Digit ZIP Report.
![]() Code Set - Choose a code set of interest. You can only choose one code set at a time.
Code Set - Choose a code set of interest. You can only choose one code set at a time.
![]() Detailed steps are shown below under State Report and 3-Digit ZIP Report.
Detailed steps are shown below under State Report and 3-Digit ZIP Report.
State Report
|
For the next step before looking at the tables, you will need to set up the market and code set you want to analyze. To do this you will use the filters at the top of the page.
|
|
 |
|
| Click on the "Patient Location" button to choose a market to analyze. A dropdown | |
|
You can type in the state abbreviation in the top search field or scroll through the list to find the state or states of your choice. Click on the checkbox to the left of the name to select the state.
|
 |
|
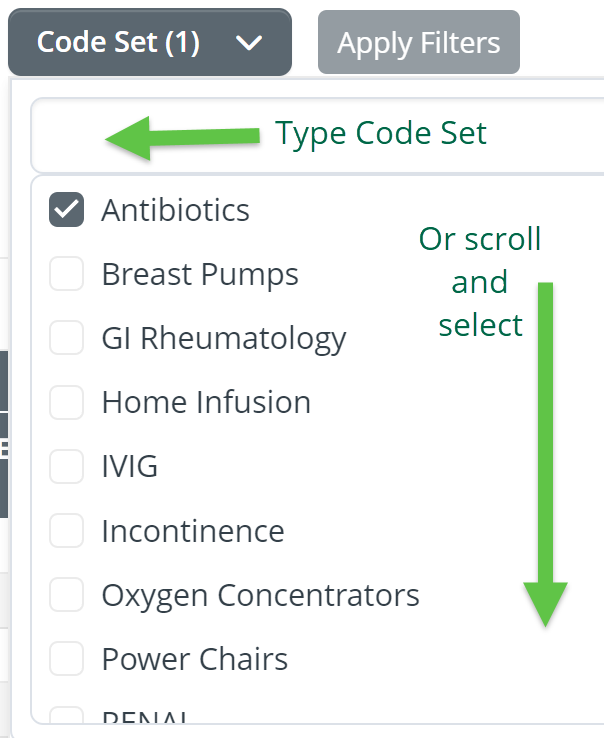
Next you will need to choose the Code Set you want to use in your evaluation. Click on the "Code Set" button to open the options |
|
|
You can type the Code Set name in the search field if you know it, or scroll through the list until you find the Code Set of interest. Click on the checkbox to the left of the name to select the Code Set.
|
 |
|
Once you are done making your selections, click on the "Apply Filters" button. |
|
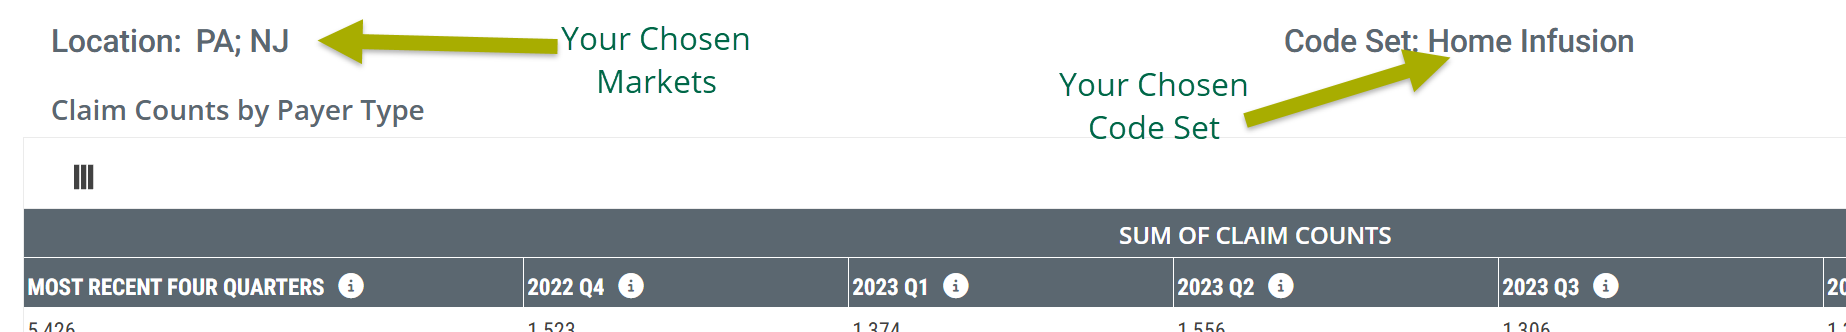
![]() Once you make your selection and click the "Apply Filters" button, your selections will be applied to all tables on the page. Your selections will be displayed above each table and will be referred to as the "specified" code set and state in the definitions in the tables.
Once you make your selection and click the "Apply Filters" button, your selections will be applied to all tables on the page. Your selections will be displayed above each table and will be referred to as the "specified" code set and state in the definitions in the tables.
3 Digit ZIP code Report with map
When you choose the 3 Digit ZIP Code report, the filters are slightly different, and a map is available once you select a state in the "Patient Location" filter.
![]() Some details
Some details
- Until you set up the "Patient Location" filter you will not see any map.
- When you choose a 3-digit ZIP code, you are selecting all 5-digit ZIP codes that start with the 3-digits chosen.
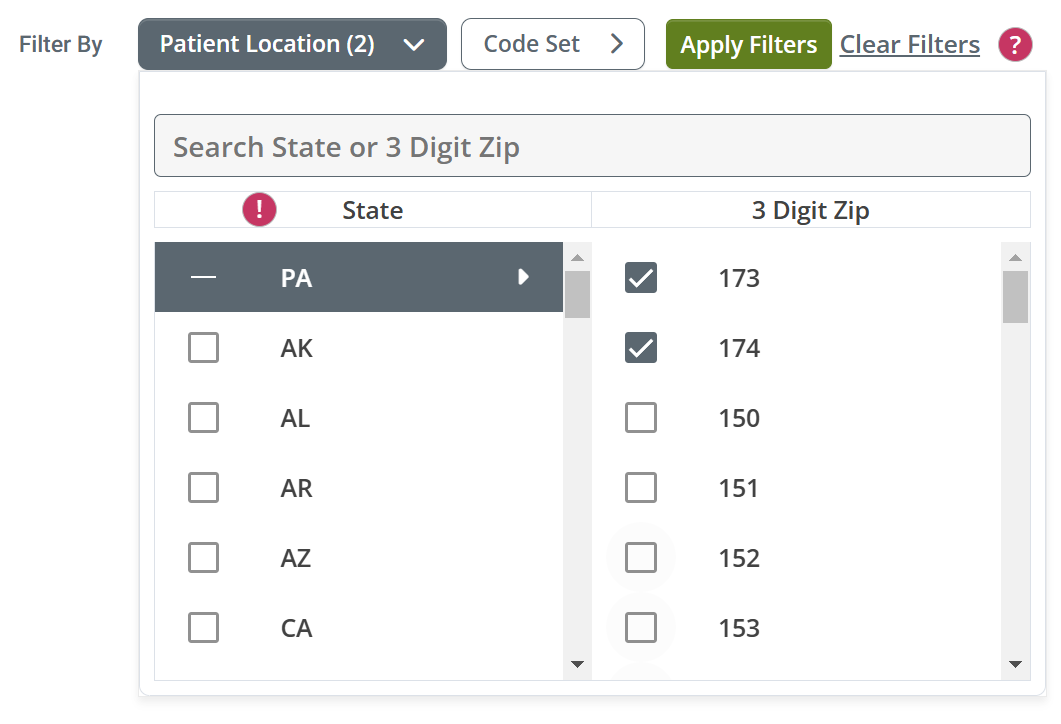
- We choose 174 in our example below, the metrics in the tables will be those calculated from patient who live in ZIP codes 17400, 17401, 17402... all the way to 17499.
- Using 3-digit ZIP codes allows you to focus on a much more specific region.
- Moreover, if you choose two different states, and then choose adjoining ZIP codes, you can analyze small markets across state lines.
Setting the 3 Digit Filters
| After choosing the "3 Digit Report" you will need to set the "Patient Location" filter and choose a code set. | |
|
|
|
|
| When you first open the dropdown, no state will be selected. However, Alaska (AK) will have focus as indicated by the color and the list of Alaska ZIP codes in the 3 Digit ZIP Code column | 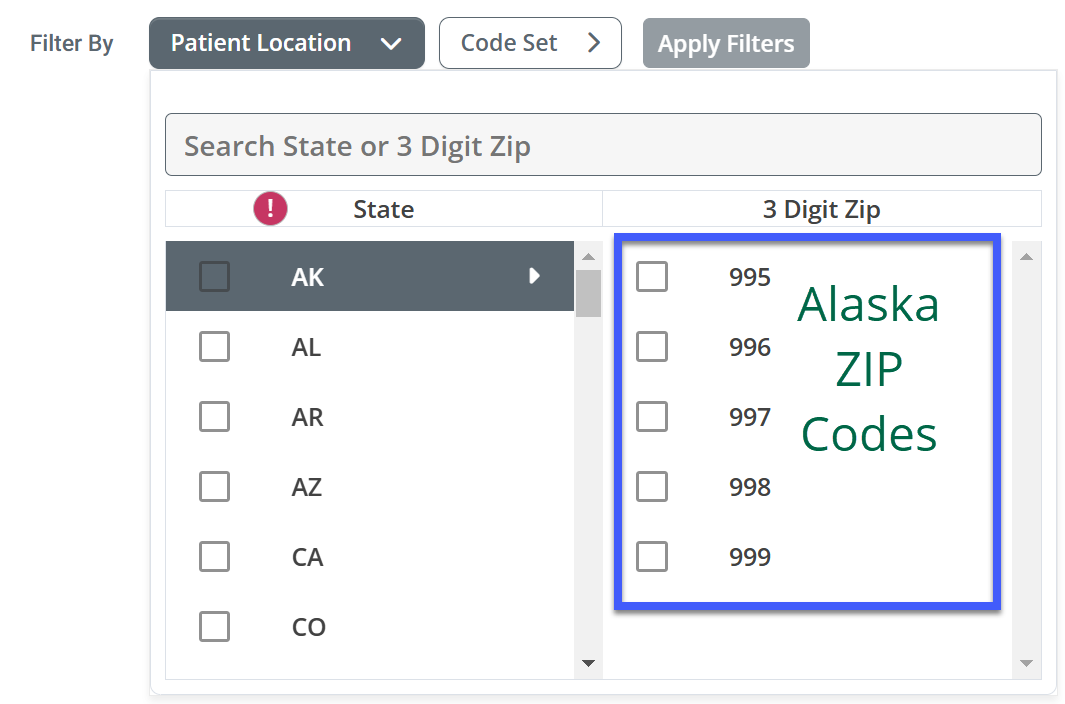 |
|
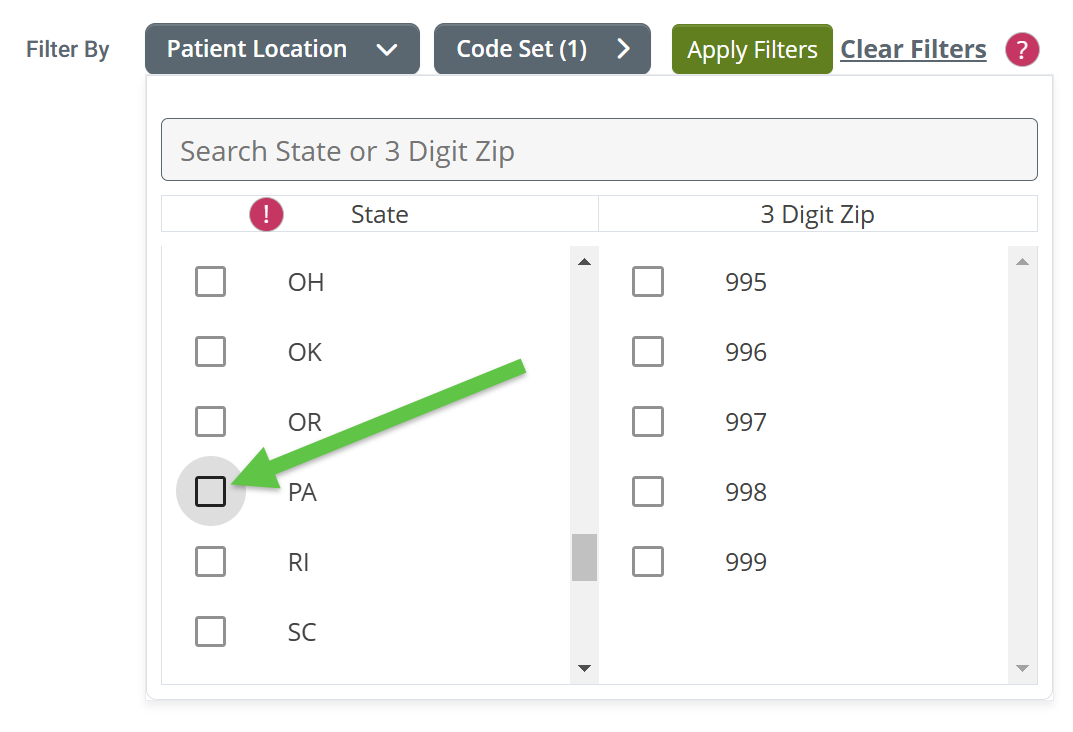
You can use the "Search" field, or scroll down to find the State (or states) you want to add. For this example, we scrolled down and will click on PA. |
 |
|
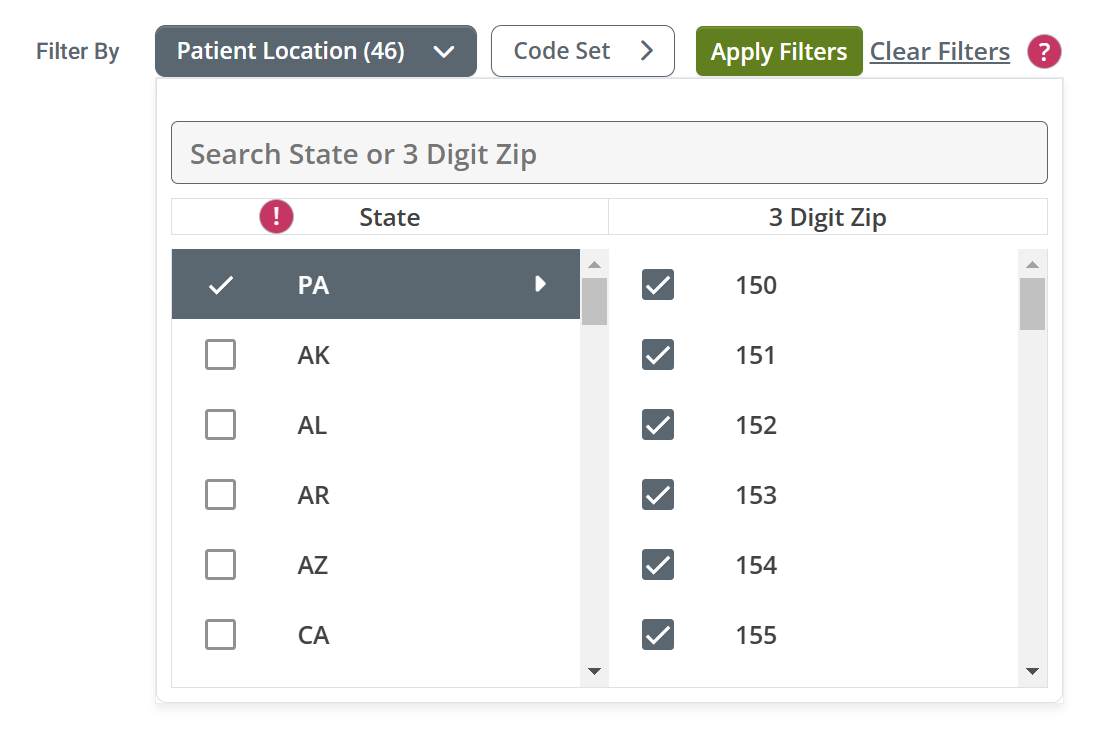
Notice that PA disappears from the list, and that the Alaska (AK) ZIP codes are still being displayed. When you choose a state, it is moved to the top of the list, but it isn't fully selected. |
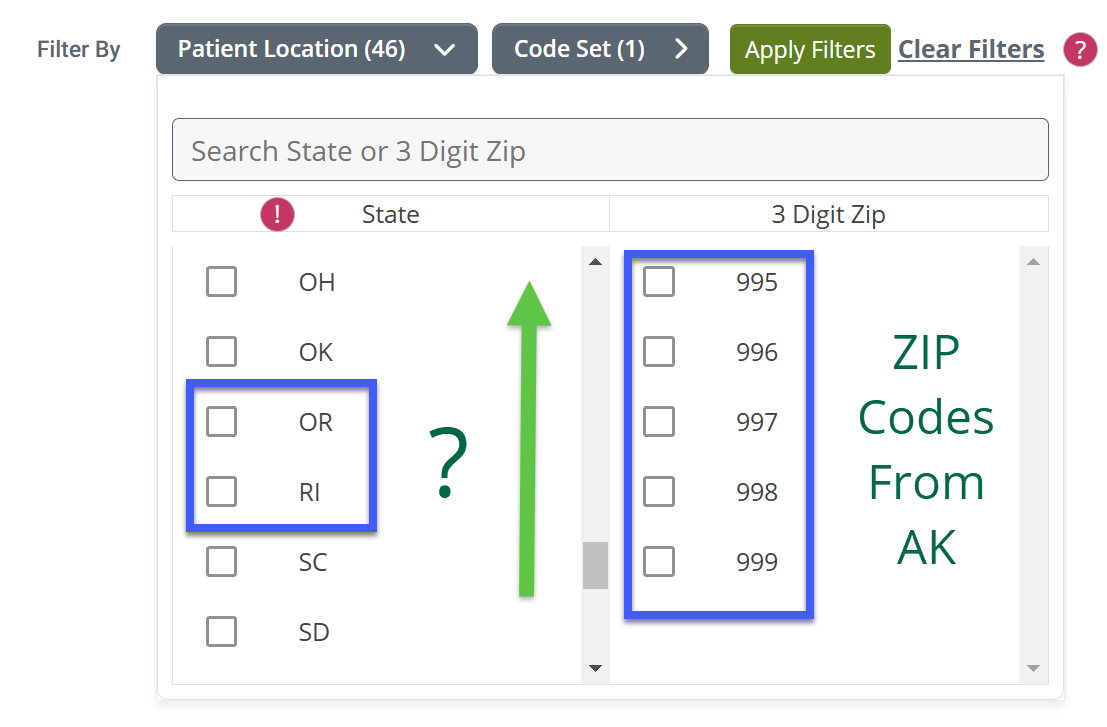 |
| Notice that even though PA has a checkbox that is checked, the Alaska ZIP codes are displayed. You need to click on the row of your selected state to give the that state focus and display the state's ZIP codes. (Click the 2 letter state abbreviation.) | 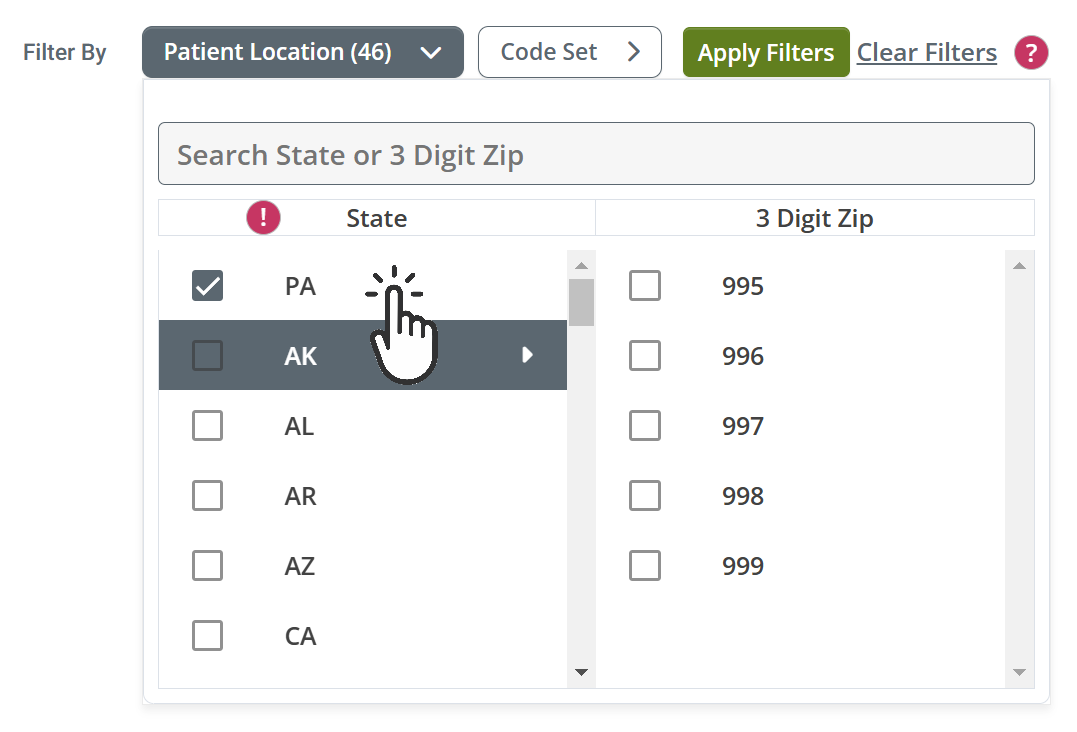 |
|
When you click on the state's row, all ZIP codes for that state appear in the right column. By default, all 3 digit ZIP codes are selected. Click each check box on or off to choose the ZIP codes you want to use on the page
|
 |
|
For this example, we chose two ZIP codes. If you were adding nearby ZIP codes from another state, you would click the state to display the state's ZIP codes, and choose the ZIP codes you want. When you are done, click the "Patient Location" button to close the dropdown options. |
 |
| Choosing a Code Set | |
|
You can search for the desired code set by typing it into the search field, or you can scroll through the list. Click on the checkbox for the code set you want to use for the metrics on the page. You can choose only one code set at a time |
|
| When you have set the "Patient Location" filter and the "Code Set" filter, click on the "Apply Filters" button to apply your filters to the page | |
![]() Once you make your selection and click the "Apply Filters" button, your selections will be applied to all tables on the page. Your selections will be displayed above each table and will be referred to as the "specified" code set and state in the definitions in the tables.
Once you make your selection and click the "Apply Filters" button, your selections will be applied to all tables on the page. Your selections will be displayed above each table and will be referred to as the "specified" code set and state in the definitions in the tables.

Using the Map
|
When you click on a state in the "Patient Location" dropdown, the state will appear to the right side of the page.
|
 |
To find the ZIP codes we wanted, we zoomed to the area around the city where our office is located. The 3 digit codes are shown on the map. |
 |
Understanding the Metrics
National Claim Counts by Payer Type
![]() All metrics shown on the page will reflect on the code set chosen. The national metrics in this table will not change if you choose a different location. The metrics displayed provide a benchmark of national trends for the selected code set broken out by payer type.
All metrics shown on the page will reflect on the code set chosen. The national metrics in this table will not change if you choose a different location. The metrics displayed provide a benchmark of national trends for the selected code set broken out by payer type.
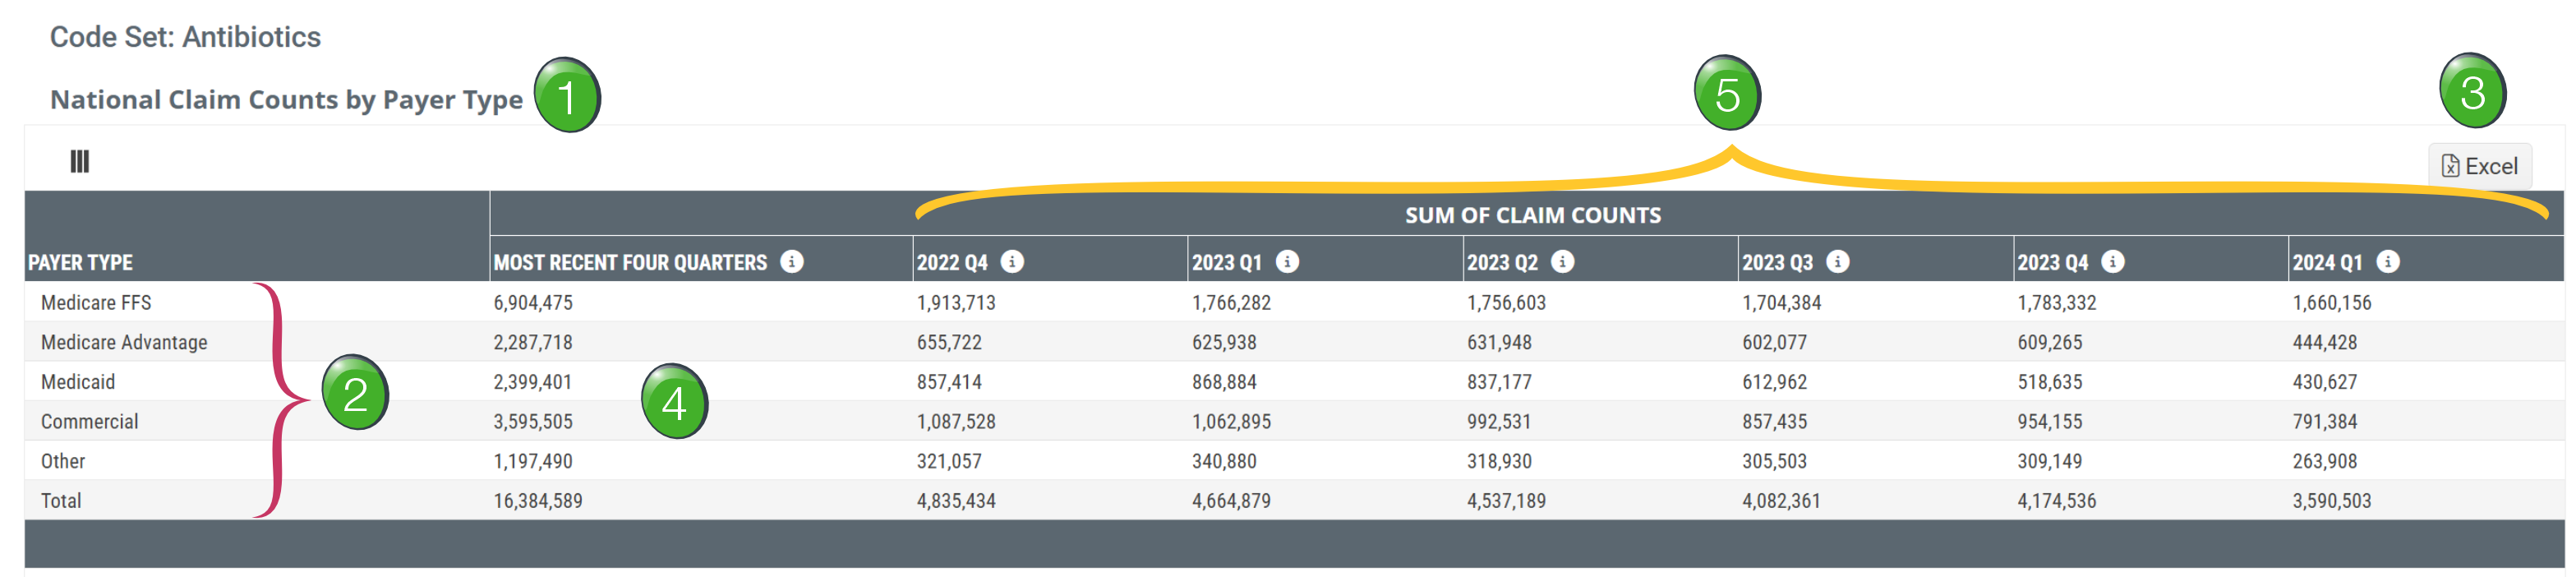
![]() Code Set - The chosen code set is identified above the table title. The claim counts in the table are limited to claims associated with the selected code set.
Code Set - The chosen code set is identified above the table title. The claim counts in the table are limited to claims associated with the selected code set.
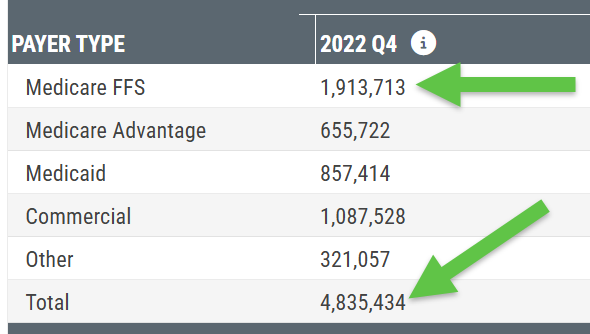
![]() Payer Type - Each row contains claim counts for the listed payer.
Payer Type - Each row contains claim counts for the listed payer.
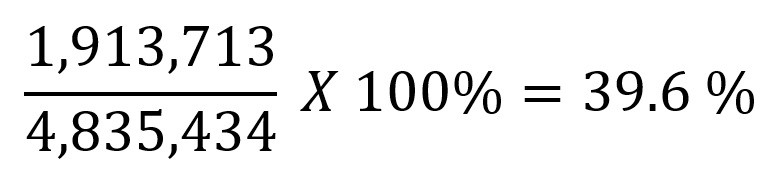
 Since we provide a total at the bottom of each column, you can easily generate a percentage for any count.
|
Use the following calculation to generate a percentage for any count.
|
 |
What is "Other?"
Other is any claim submitted from a source that is not Traditional Medicare FFS, Medicare Advantage, Medicaid or a commercial plan during the most recent 18 months for the listed code set. Possible sources of these claims will typically consist of VA, Tricare, Workers Comp or unknown payers.
![]() Excel Export - Click the "Excel" button to export the contents of the table as a Excel spreadsheet. You can then work with the numbers.
Excel Export - Click the "Excel" button to export the contents of the table as a Excel spreadsheet. You can then work with the numbers.
![]() If you export the table of metrics to the Excel spreadsheet - your first step should be to rename the sheet to match the chosen code set, or add it to the table title at the top of the page.
If you export the table of metrics to the Excel spreadsheet - your first step should be to rename the sheet to match the chosen code set, or add it to the table title at the top of the page.
![]() Most Recent Four Quarters - The first column of numbers are claim counts for the most recent four quarters of available data.
Most Recent Four Quarters - The first column of numbers are claim counts for the most recent four quarters of available data.
![]() Since the counts in this table are claims, the numbers in the columns for the most recent four quarters will add up to the total in the first column.
Since the counts in this table are claims, the numbers in the columns for the most recent four quarters will add up to the total in the first column.
![]() Quarterly Trended counts - The table includes 6 quarters of claim counts for the payer types included in each row.
Quarterly Trended counts - The table includes 6 quarters of claim counts for the payer types included in each row.
 Definition
Based on the selected code set, the metrics in each column are line counts of estimated national claims identified for the period listed in the column header.
Claim Counts by Payer Type

![]() Above each table on the Market Evaluation page the state and code set selected using the filters at the top are listed as a reminder. In the definitions in the table, these are called the "specified" state and code set. The table will show metrics that pertain to the selected state and code set.
Above each table on the Market Evaluation page the state and code set selected using the filters at the top are listed as a reminder. In the definitions in the table, these are called the "specified" state and code set. The table will show metrics that pertain to the selected state and code set.
![]() The table name identifies what will be shown in the table. The "Claim Counts" in this table are "line counts of estimated claims attributed to the listed payer." The different payers are listed in the leftmost column along with a total patient count in the bottom row.
The table name identifies what will be shown in the table. The "Claim Counts" in this table are "line counts of estimated claims attributed to the listed payer." The different payers are listed in the leftmost column along with a total patient count in the bottom row.
![]() Click the "Excel" button to download the metrics shown in the table for use in an Excel spreadsheet.
Click the "Excel" button to download the metrics shown in the table for use in an Excel spreadsheet.
![]() The leftmost column shows the payer for which the metrics in the row were counted.
The leftmost column shows the payer for which the metrics in the row were counted.
![]() Although each of the row names includes the word "patients," the counts in each row are not counts of patients, but "line counts" from claims for, for example, "Medicare FFS patients." Since the table is a list of payers, you can remove the word "patients" from the row header to consider the payer as Medicare FFS, MA, Medicaid, Commercial, or Other.
Although each of the row names includes the word "patients," the counts in each row are not counts of patients, but "line counts" from claims for, for example, "Medicare FFS patients." Since the table is a list of payers, you can remove the word "patients" from the row header to consider the payer as Medicare FFS, MA, Medicaid, Commercial, or Other.
![]() The first column of counts is an annual count - Based on the specified (selected) state and code set, this metric is a line count of estimated claims attributed to the listed payer during the one-year reporting period. Since this is a count of applicable lines rather than patients, the counts in this column are a total of the counts from the most recent four quarters.
The first column of counts is an annual count - Based on the specified (selected) state and code set, this metric is a line count of estimated claims attributed to the listed payer during the one-year reporting period. Since this is a count of applicable lines rather than patients, the counts in this column are a total of the counts from the most recent four quarters.
![]() The remaining columns are quarterly trended counts. - Based on specified (selected) state and code set, this metric is a line count of estimated claims attributed to the listed payer during the quarter specified in each header.
The remaining columns are quarterly trended counts. - Based on specified (selected) state and code set, this metric is a line count of estimated claims attributed to the listed payer during the quarter specified in each header.
![]() This field will help identify the number of claims for the selected product for each specified period, quarter or annual, based on patient location.
This field will help identify the number of claims for the selected product for each specified period, quarter or annual, based on patient location.
Physicians by Code Set by Patient Location
![]() Click on the image to enlarge it.
Click on the image to enlarge it.
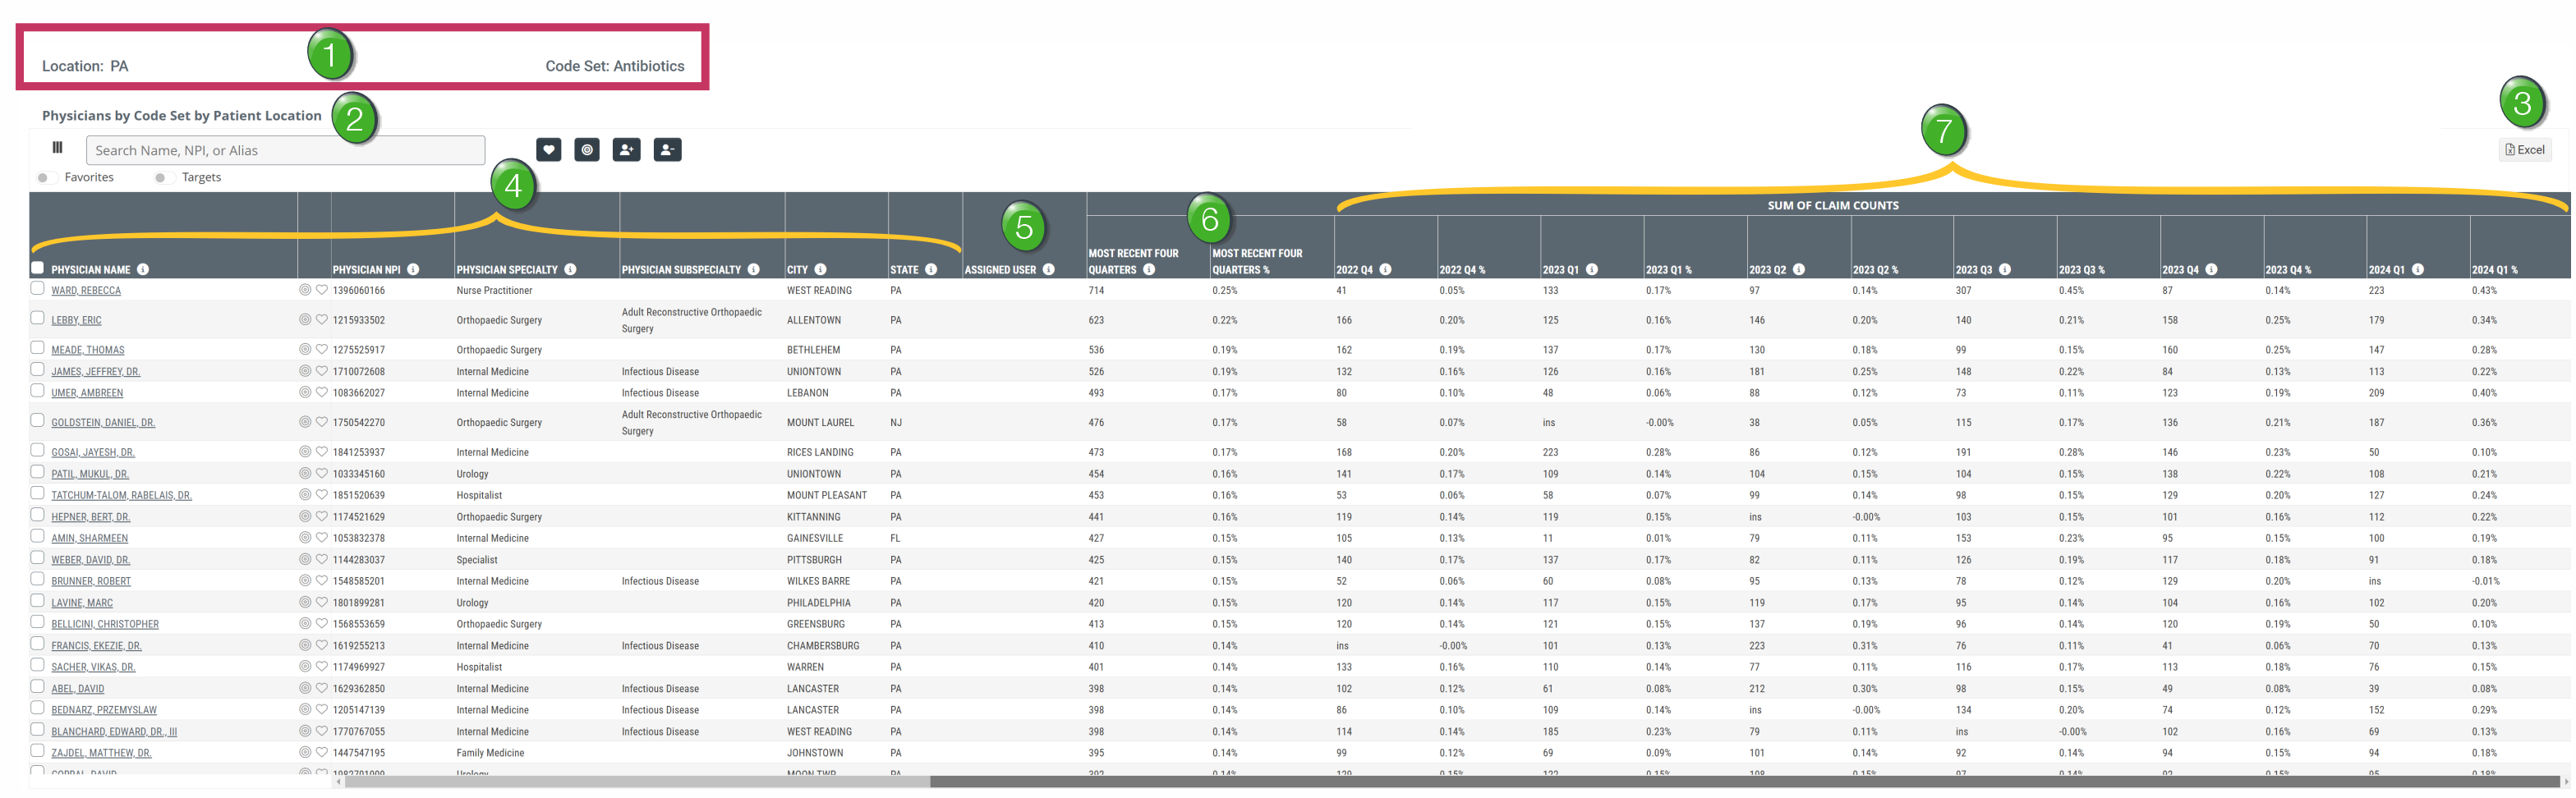
![]() Above each table on the Market Evaluation page the state and code set selected using the filters at the top are listed as a reminder. In the definitions in the table, these are called the "specified" state and code set. The table will show metrics that pertain to the selected state and code set.
Above each table on the Market Evaluation page the state and code set selected using the filters at the top are listed as a reminder. In the definitions in the table, these are called the "specified" state and code set. The table will show metrics that pertain to the selected state and code set.
![]() The table name identifies what will be shown in the table. The counts in each row are line counts of estimated claims submitted by the listed physician in each row.
The table name identifies what will be shown in the table. The counts in each row are line counts of estimated claims submitted by the listed physician in each row.
![]() Click the "Excel" button to download the metrics shown in the table for use in an Excel spreadsheet.
Click the "Excel" button to download the metrics shown in the table for use in an Excel spreadsheet.
![]() The leftmost column shows the Physician for which the metrics in the row were counted. Also included is the listed physician's NPI, specialty, sub-specialty and the physician's primary location (city and state).
The leftmost column shows the Physician for which the metrics in the row were counted. Also included is the listed physician's NPI, specialty, sub-specialty and the physician's primary location (city and state).
![]() Assigned Users - This column shows the users in your company who are assigned to the physician listed in each row.
Assigned Users - This column shows the users in your company who are assigned to the physician listed in each row.
![]() The first two column of metrics include an annual count and an annual percentage - Based on the specified (selected) state and code set, these metrics are a line count of estimated claims attributed to the listed physician during the one-year reporting period and the percentage of total claims the count for each physician represents.
The first two column of metrics include an annual count and an annual percentage - Based on the specified (selected) state and code set, these metrics are a line count of estimated claims attributed to the listed physician during the one-year reporting period and the percentage of total claims the count for each physician represents.
![]() The remaining columns are quarterly trended claim counts and percentages. - Based on specified (selected) state and code set, these metrics are a line count of estimated claims attributed to the listed physician during the one-year reporting period and the percentage of total claims the count for each physician represents.
The remaining columns are quarterly trended claim counts and percentages. - Based on specified (selected) state and code set, these metrics are a line count of estimated claims attributed to the listed physician during the one-year reporting period and the percentage of total claims the count for each physician represents.
Billing Entities by Code Set by Patient Location
![]() Click on the image to enlarge it.
Click on the image to enlarge it.
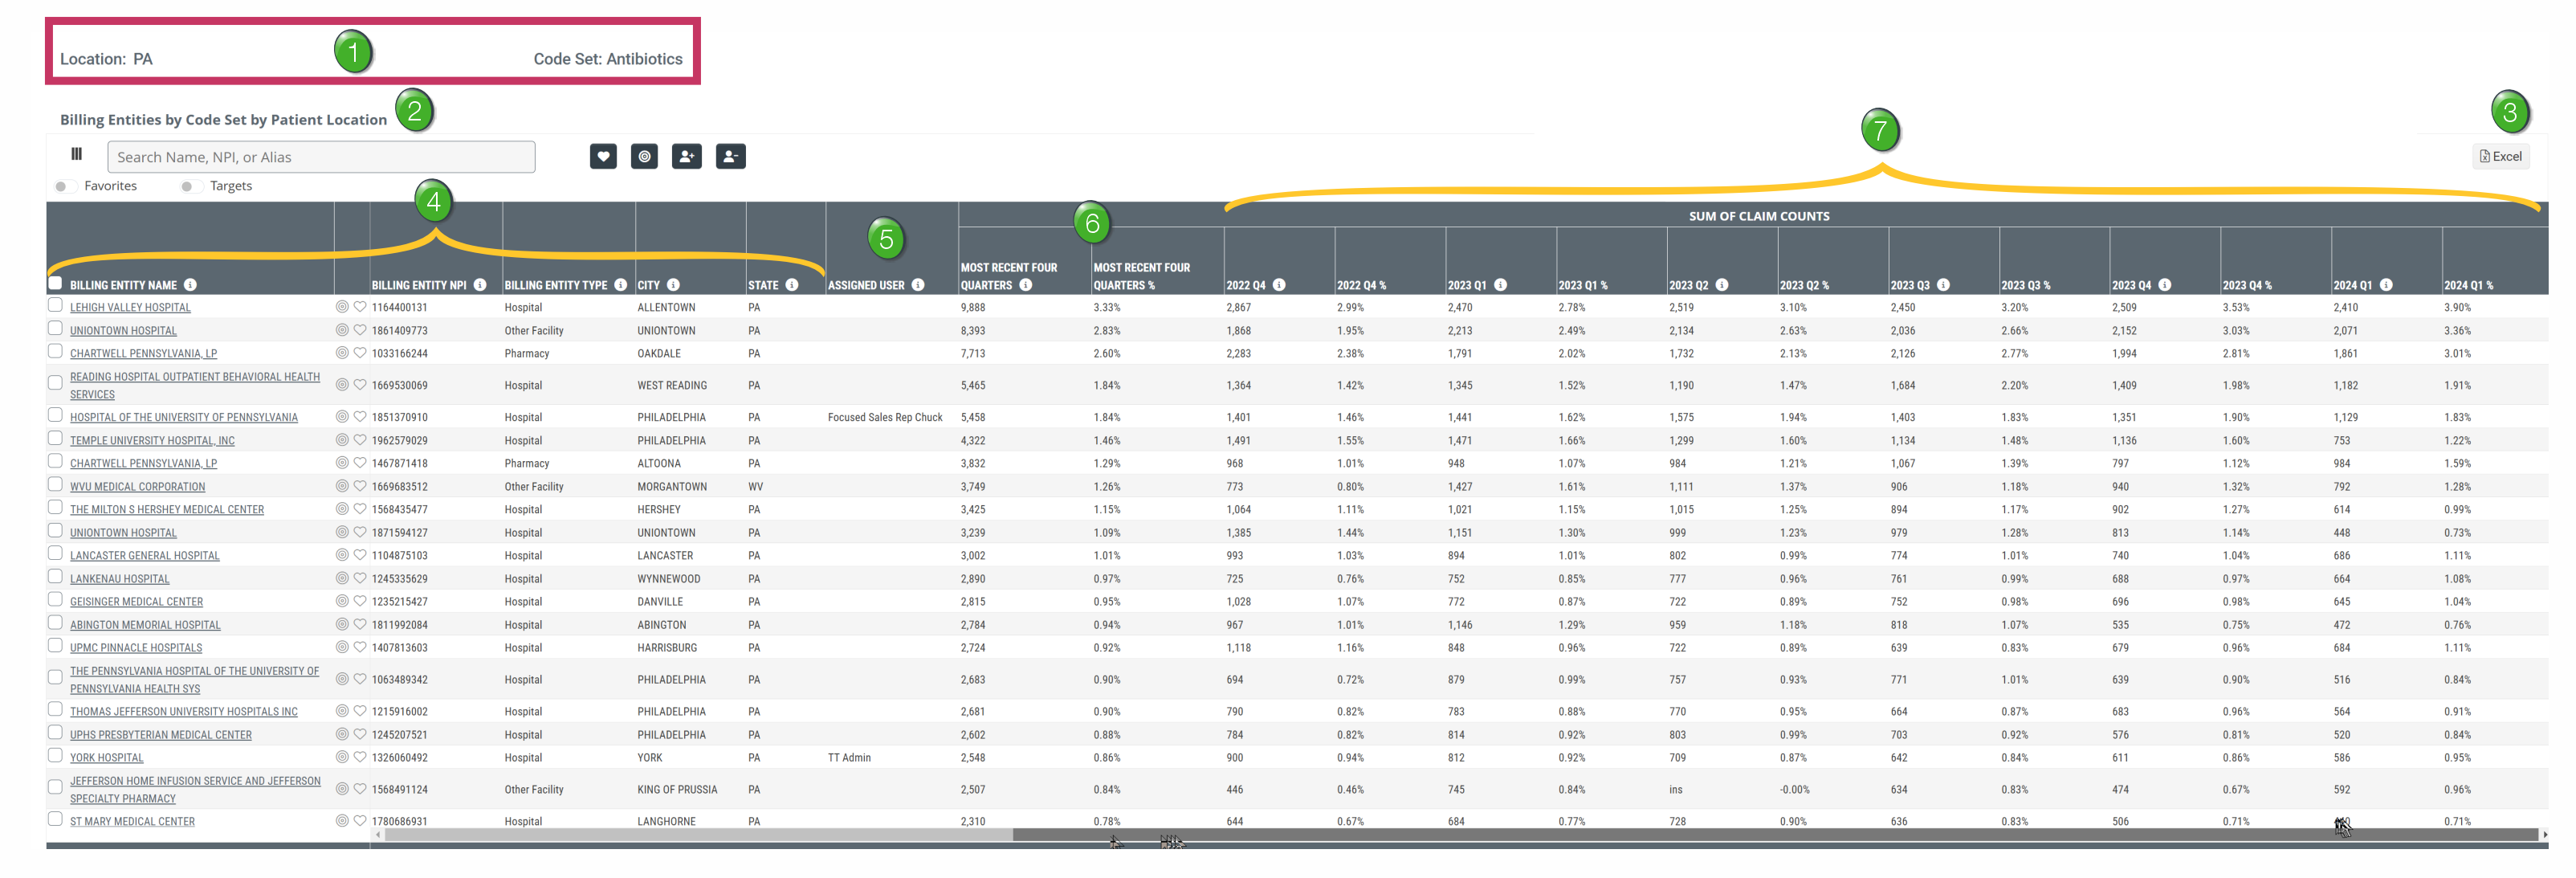
![]() Above each table on the Market Evaluation page the state and code set selected using the filters at the top are listed as a reminder. In the definitions in the table, these are called the "specified" state and code set. The table will show metrics that pertain to the selected state and code set.
Above each table on the Market Evaluation page the state and code set selected using the filters at the top are listed as a reminder. In the definitions in the table, these are called the "specified" state and code set. The table will show metrics that pertain to the selected state and code set.
![]() The table name identifies what will be shown in the table. The counts in each row are line counts of estimated claims submitted by the listed billing entity in each row.
The table name identifies what will be shown in the table. The counts in each row are line counts of estimated claims submitted by the listed billing entity in each row.
![]() Click the "Excel" button to download the metrics shown in the table for use in an Excel spreadsheet.
Click the "Excel" button to download the metrics shown in the table for use in an Excel spreadsheet.
![]() The leftmost column shows the billing entity for which the metrics in the row were counted. Also included is the NPI, the billing entity type, and the location of the billing entity (city and state).
The leftmost column shows the billing entity for which the metrics in the row were counted. Also included is the NPI, the billing entity type, and the location of the billing entity (city and state).
![]() Assigned Users - This column shows the users in your company who are assigned to the billing entity listed in each row.
Assigned Users - This column shows the users in your company who are assigned to the billing entity listed in each row.
![]() The first two column of metrics include an annual count and an annual percentage - Based on the specified (selected) state and code set, these metrics are a line count of estimated claims attributed to the listed billing entity during the one-year reporting period and the percentage of total claims the count for each billing entity represents.
The first two column of metrics include an annual count and an annual percentage - Based on the specified (selected) state and code set, these metrics are a line count of estimated claims attributed to the listed billing entity during the one-year reporting period and the percentage of total claims the count for each billing entity represents.
![]() The remaining columns are quarterly trended claim counts and percentages. - Based on specified (selected) state and code set, these metrics are a line count of estimated claims attributed to the listed billing entity during the one-year reporting period and the percentage of total claims the count for each billing entity represents.
The remaining columns are quarterly trended claim counts and percentages. - Based on specified (selected) state and code set, these metrics are a line count of estimated claims attributed to the listed billing entity during the one-year reporting period and the percentage of total claims the count for each billing entity represents.
![]() This field will help identify the number of claims for the selected product for each listed billing entity for the latest year, or trended over 6 quarters for patients who lived in the selected market.
This field will help identify the number of claims for the selected product for each listed billing entity for the latest year, or trended over 6 quarters for patients who lived in the selected market.
FAQs
![]() What is the difference between the physicians listed on the Explore page and those listed on the Market Evaluation page?
What is the difference between the physicians listed on the Explore page and those listed on the Market Evaluation page?
Answer: Metrics for physicians shown in the table on the Explore page are based on the location of the physician’s registered NPI – metrics for physicians shown in the table on the Market Evaluation page are based on the location of the patients' residence.
If you were to export the metrics from the Physicians by Code Set by Patient Location table and the Billing Entities by Code Set by Patient Location table so that you could get a total count of claims for those tables, you would notice that the claim counts by quarter are different between the organizations, physicians, and payer mix. For example, if you select IVIG code set in GA, here are the total claims for the last four quarters by table:
Payer Mix: 100k
Physicians: 66k
Organizations: 68k
![]() Why is that?
Why is that?
Answer: Trella Health’s contract with CMS requires that any counts where there are less than 11 claims must be suppressed for privacy concerns. Any physicians or organizations whose code set and geographic region combination that did not have at least 11 claims within the Medicare FFS data were suppressed and not included in either that physician or organization count. However, when blended with other commercial sources, there are cases in which the contract with CMS does not apply and Trella can display claim counts that are less than 11.