Overview
One of the primary purposes behind the design of the Explore page in Trella Insights for HME/Infusion is to provide the tools to help you to target acute and post-acute organizations that have patients that need the products you sell. Some organizations specialize in a certain type of patient that would need specific HME/INF products. The Explore page allows you to pick an organization type of interest and then browse or sort the listed providers to find those with a high patient count for a specific product you sell.
 In this article
Organization Types
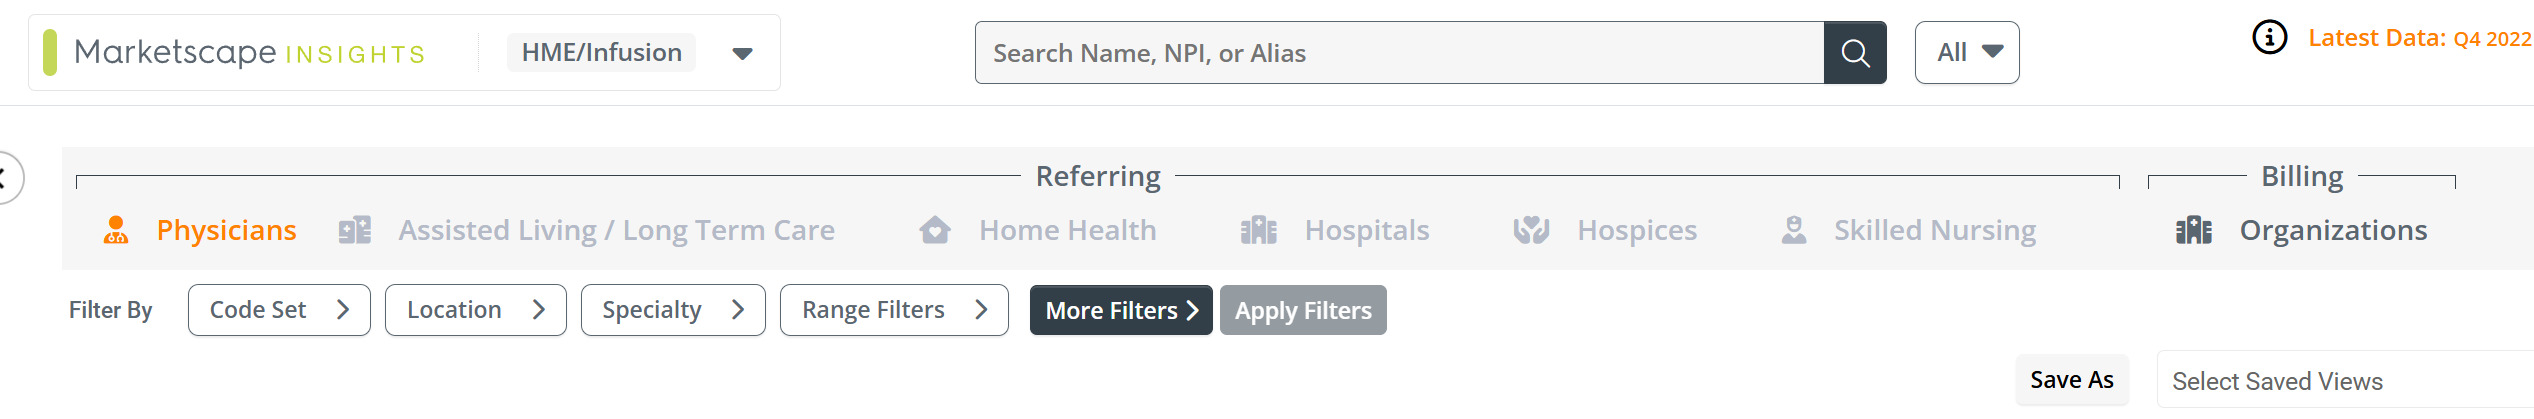
The following image shows the organization types available on the Explore page.

![]() If the tabs are grayed out, as in the image below, you do not have access to the facilities tabs. Please make contact with your customer success manager for more information.
If the tabs are grayed out, as in the image below, you do not have access to the facilities tabs. Please make contact with your customer success manager for more information.
Targeting Simplified
![]() The goal is simple: find organizations that treat patients that need products you sell.
The goal is simple: find organizations that treat patients that need products you sell.
|
|
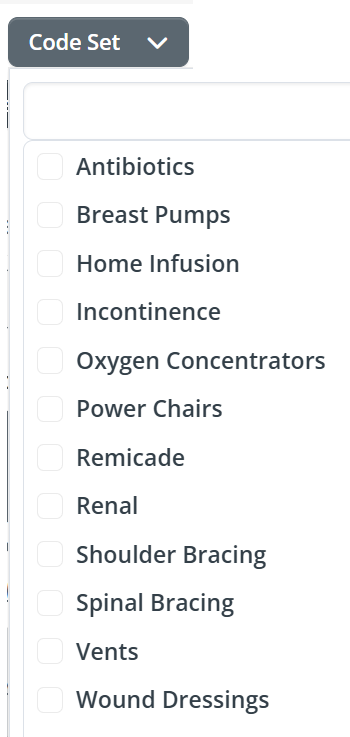 |
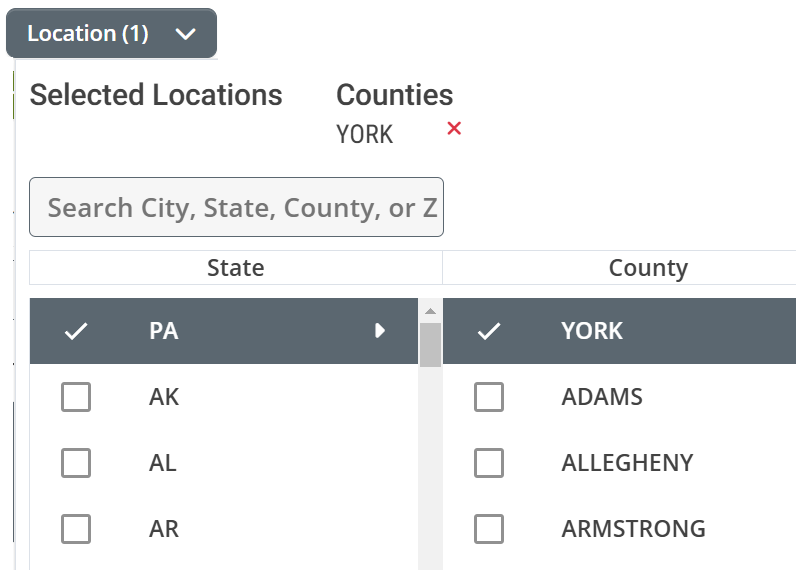
![]() In most cases, you will start by setting the Code Set filter and then you will set the Location filter. For some users you will only have access to a single code set, which will save you a step.
In most cases, you will start by setting the Code Set filter and then you will set the Location filter. For some users you will only have access to a single code set, which will save you a step.
|
|
|
|
|
 |
![]() Sort by a patient count column
Sort by a patient count column
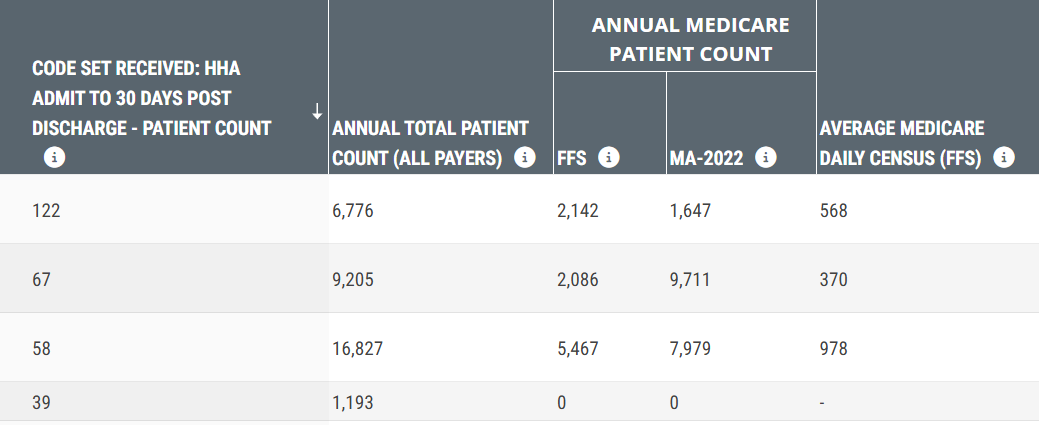
Clicking on the text in a column header will sort the column to bring the largest counts to the top. The image below (taken from the Home Health Explore page) shows a sample of the patient count metrics that might appear for a specific organization. That is, the metrics available for each organization type are different.
![]() Details
Details
- Sorting by any of the columns shown will display organizations with the largest patient counts for the category in the column selected.
- Think of each patient count column as a different window into each organization's patient population. If you want to focus more on Medicare FFS, sort the table by Annual Medicare Patient Count - FFS.
- After you sort by a specific column, it is useful to compare metrics in the sorted column to metrics in other columns.
Special Metric Note
A metric from the above image, Code Set Received: HHA Admit to 30 Days post Discharge - Patient Count, demonstrates an inferred referral relationship for patients discharged from the listed home health agency. This is a unique patient count that connects two separate claim events.
- We look for a HCPCS claim for the code set listed in the row - (for a specific patient).
- We look back at the previous thirty days to see if the patient was receiving care at the home health agency listed in the row.
The resulting count shows the number of patients treated at the home health agency who subsequently received services/products tied to the listed code set. Although we can't know for certain that a referral was made, the close time-connection implies a high probability of a referral.
![]() More
More
- This metric can be found for hospitals under the Hospitals tab and for skilled nursing facilities under the Skilled Nursing tab.
- This is one of those metrics where our best efforts don't provide us access to both claims. It is highly likely that the patient counts in this column are lower than actual.
Final Targeting comments
- Some organization types have additional metrics that allow you to further nuance the results shown in the table.
- Once you have filtered and sorted, click on the resulting organization names at the far left of the table to open the Analyze page for the targeted organizations to dig in on more details.
![]() For more information on how to use filters effectively, see Filters - Overview and Strategy.
For more information on how to use filters effectively, see Filters - Overview and Strategy.
Shortcuts
Now that you have the targeting strategy, you can use the links below to look at more details for the different organization types. (Each Organization Type listed below is a link.)
![]()
![]()
![]()
![]()
![]()